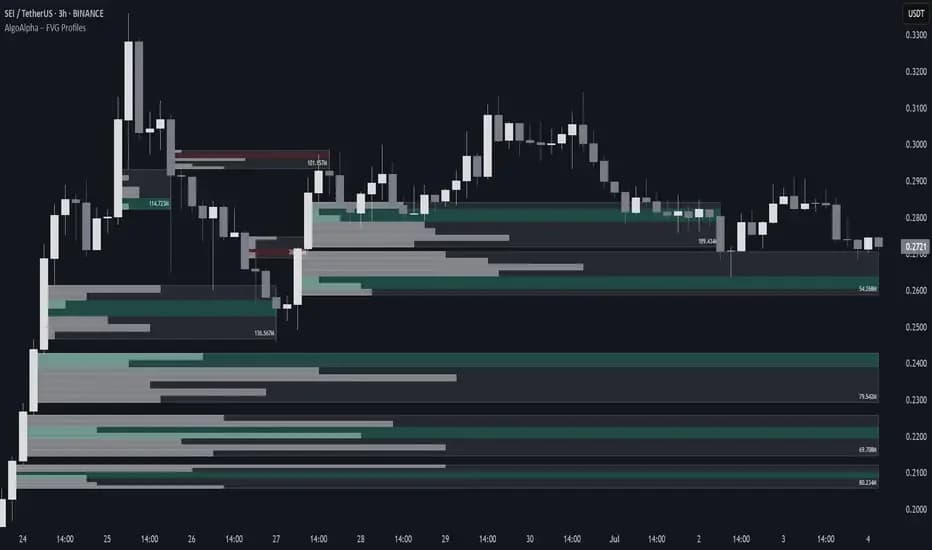
TLDR: A fair value gap (FVG) is a three-candle chart pattern where the first and third candles' wicks do not overlap. This guide defines the zone boundaries, uses a close beyond the far boundary as its invalidation rule, and gives an illustrative example. The pattern does not identify who traded or predict that price will return or react.
What Is a Fair Value Gap?
A fair value gap (FVG) is a three-candle pattern defined by non-overlapping wicks on candles one and three, with the middle candle moving in the direction of the gap. The pattern is a charting convention; it does not establish that price was not traded there or identify the participants behind the move.
The term is used in Inner Circle Trader (ICT) and broader Smart Money Concepts (SMC) material. Some traders interpret the pattern as an imbalance and watch for a return to the zone, but the chart does not show institutional activity or prove that orders remain unfilled.
Illustrative example, not historical market data: if candle one's high is $100 and candle three's low is $103, this convention marks $100–$103 as a bullish FVG. The $101.50 midpoint is one reference some traders use, not a preferred or guaranteed entry.
Key distinction:A fair value gap is not the same as a regular price gap (like overnight gaps). FVGs occur within continuous trading sessions and are defined by a specific three-candle structure, not by a literal gap between closing and opening prices.
How to Identify Fair Value Gaps on Any Chart
Spotting fair value gaps comes down to one rule: find a three-candle sequence where the wicks of the first and third candles do not overlap. The space between those wicks is your FVG. Here is exactly how to identify both types.
Bullish Fair Value Gap
A bullish FVG forms during an upward move and signals a potential support zone where price may bounce if it retraces.
-
Find a strong bullish (green) candle with candles on both sides of it.
-
Check thehigh of candle 1(the candle before the big move). This is the bottom boundary of your FVG.
-
Check thelow of candle 3(the candle after the big move). This is the top boundary of your FVG.
-
If candle 1's high islower thancandle 3's low, you have a valid bullish FVG. The zone between these two levels is the gap.
If price trades into the zone, that is a partial fill. For this guide's rule, a candle close below the lower boundary (candle one's high) invalidates the bullish setup; a wick through it alone does not.
Bearish Fair Value Gap
A bearish FVG forms during a downward move and acts as a potential resistance zone.
-
Find a strong bearish (red) candle with candles on both sides.
-
Check thelow of candle 1. This is the top boundary of your FVG.
-
Check thehigh of candle 3. This is the bottom boundary.
-
If candle 1's low ishigher thancandle 3's high, you have a valid bearish FVG.
If price trades into the zone, that is a partial fill. For this guide's rule, a candle close above the upper boundary (candle one's low) invalidates the bearish setup; a wick through it alone does not.
How Traders Interpret Fair Value Gaps
Some SMC traders watch whether price returns to the zone. A touch or fill does not by itself establish a trade entry; use a defined trigger and invalidation rule.
Fair Value Gap Trading Approaches
Finding FVGs is only one part of a trading plan. The following are example rules to evaluate, not tested or ranked strategies.
Strategy 1: FVG + Higher-Timeframe Trend Alignment
This is one approach traders may choose to test.
-
Determine the trend on the 4H or Daily chart.If the market is making higher highs and higher lows, you only look for bullish FVGs. In a downtrend, only bearish FVGs.
-
Drop to the 15M or 1H chartand identify FVGs that formed during impulsive moves in the trend direction.
-
Wait for price to retrace into the FVG zone.Do not chase—let price come to you.
-
For this example, use the 50% level (midpoint) of the FVG as the planned entry reference. Compare the target and stop distances before deciding whether the setup meets your rules.
-
Place your stop-lossjust beyond the far edge of the FVG. For a bullish FVG, the stop goes below candle 1’s high. For a bearish FVG, above candle 1’s low.
-
Target the next swing high/lowor a 2:1 reward-to-risk ratio minimum.
Illustrative calculation, not a historical trade or result: for a $100–$103 bullish FVG, a hypothetical entry at $101.50 and invalidation at $100 creates $1.50 of price risk per unit before fees or slippage. This arithmetic does not say the setup will work. After choosing a stop, estimate units with the position size calculator.
Strategy 2: FVG + Order Block Confluence
When a fair value gap overlaps with an order block, some traders use both markings as confluence. The overlap is an additional chart condition, not evidence of a higher probability.
-
Identify an order blockon the 1H or 4H chart—the last bearish candle before a bullish move (for a bullish OB), or vice versa.
-
Check if an FVG exists within or adjacent to the order block.The FVG should overlap with at least part of the OB zone.
-
This overlap is your high-confidence entry zone.Enter when price retraces into the overlapping area.
-
Stop-loss goes below the order block(not just the FVG), giving the trade more room while maintaining a clean invalidation level.
Pro tip:If you are using TradingView, tools like AlgoAlpha’s Smart Money Concepts indicatorcan automatically detect and plot both FVGs and order blocks on your chart, eliminating the manual work of drawing zones.
Inverse Fair Value Gaps: When FVGs Flip
An inverse fair value gap (IFVG) is one of the most misunderstood concepts in SMC trading, and it is one of the most powerful for traders who understand it.
Here is how it works: when price trades completely through a fair value gap—filling it and closing beyond it—the FVG’s role inverts. A bullish FVG that gets completely violated becomes abearishinverse FVG. A bearish FVG that price blows through becomes abullishinverse FVG.
In SMC terminology, traders may treat this failure as a role-reversal hypothesis. The chart does not show why price crossed the zone or guarantee continuation after a retest.
Trading the IFVG:When price returns to the inverted zone after violating it, expect continuation in thenewdirection. If a bullish FVG was violated to the downside, price retesting that zone from below will often get rejected—what was once support has flipped to resistance.
This concept is particularly useful for managing losing trades. Instead of taking a full loss when your FVG setup fails, recognizing the inversion gives you an immediate framework for the next trade in the opposite direction.
FVG vs. Imbalance vs. Liquidity Void: Know the Difference
These three terms get used interchangeably in trading communities, but they describe different levels of the same phenomenon. Understanding the distinction helps you read price action more accurately.
Concept
Definition
Trading Use
Fair Value Gap
Specific three-candle pattern with non-overlapping wicks
Precise entry zones with defined boundaries
Imbalance
Any area of one-sided price delivery (broader category)
General directional bias; describes one-sided price movement
Liquidity Void
Large single candle with minimal wicks (price shot through with almost no resistance)
Identifies the strongest imbalances; price may fill these aggressively
All FVGs are imbalances, but not all imbalances are FVGs. The FVG is the most precise of the three because it gives you exact upper and lower boundaries for your trading zone.
Best Timeframes and Markets for Fair Value Gap Trading
FVGs form on every timeframe, but not all timeframes are equally useful. The optimal choice depends on your trading style.
For day traders:The 1-minute to 5-minute charts produce the most FVGs, but many are noise. The sweet spot is using the 15-minute chart for FVG identification while confirming trend direction on the 1H or 4H. This filters out low-quality gaps while still giving you multiple setups per day on active instruments like $ES (S&P 500 futures) or $NQ (Nasdaq futures).
For swing traders:The 4H and Daily charts produce fewer candidate gaps than shorter intervals. This article does not establish that they are more reliable or that they will hold for a set period.
For crypto traders:Because crypto markets run 24/7 with no session breaks, FVGs on $BTC and $ETH tend to fill more cleanly than on traditional markets. The 1H and 4H charts are the preferred timeframes for crypto FVG trading.
Avoid this mistake:On low-volume assets or very short intervals, compare a gap's size with spread, fees, and execution conditions.
5 Common Mistakes That Cost FVG Traders Money
The following examples show how an FVG trading plan can become inconsistent or incomplete.
Mistake 1: Trading Every FVG Without Context
Not all FVGs are created equal. A bullish FVG in a strong downtrend is likely to get violated. Always check the higher-timeframe structure first. If the 4H chart shows a clear downtrend, that bullish FVG on the 15M chart is a trap, not an opportunity.
Mistake 2: Entering at the Edge Instead of the 50% Level
A boundary entry and a midpoint entry have different entry-to-stop distances. With the same stop beyond the far boundary, a midpoint entry reduces that distance, but price may reverse before reaching it. Choose one rule before the trade and test it consistently.
Mistake 3: Ignoring FVG Invalidation
A bullish FVG is invalidated when price closes below its lower boundary (not just wicks through it). Many traders hold losing positions because price “only wicked through” the FVG. Set clear rules: if the candleclosesbeyond the FVG boundary, the setup is dead. Move on, or look for the inverse FVG play.
Mistake 4: Stacking Too Many FVGs
When multiple FVGs form in a tight range, some traders treat that as a reason to wait for clearer price structure. It does not reveal institutional commitment or establish which setup will succeed.
Mistake 5: Forgetting About Time
This guide does not establish a universal expiry time for an FVG. If your plan limits a zone's age, define the number of bars or sessions in advance and evaluate that rule for the market and timeframe you trade.
How to Combine FVGs With Order Blocks and Breaker Blocks
Fair value gaps work best when combined with other Smart Money Concepts. Here is a framework for building confluence.
FVG + Order Block:Some traders use an overlap as an additional chart condition. See the order block guide for one method of marking those zones.
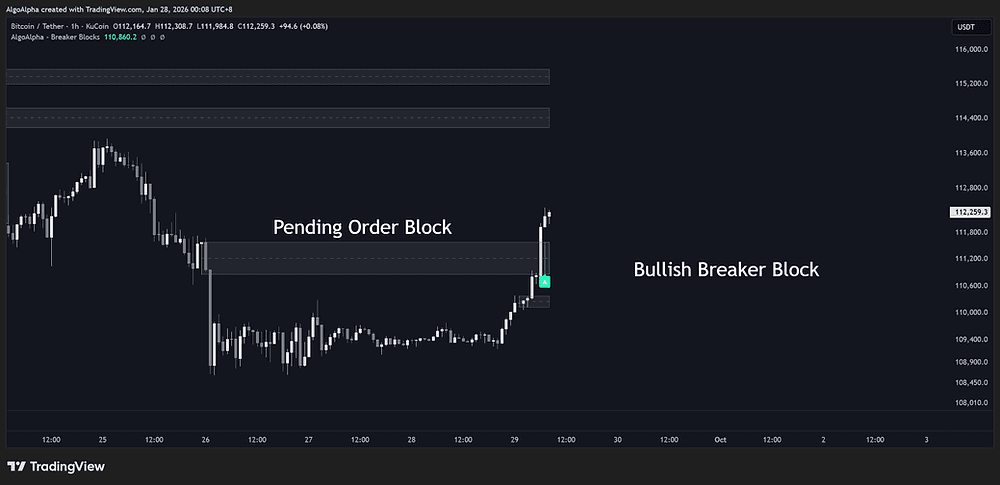
FVG + Breaker Block:Abreaker blockis a failed order block that has been violated and now acts as a zone in the opposite direction. When a new FVG forms near a breaker block, it confirms the reversal. This confluence is especially powerful at major swing points.
FVG + Liquidity Sweep:When price trades beyond a previous high and then moves into a bearish FVG, some traders use both observations as setup conditions. A price chart does not show which orders were triggered or establish a win rate for the combination.
Combining these concepts manually can be time-consuming.AlgoAlpha’s TradingView indicatorsare designed to automate the detection of these patterns, highlighting confluence zones directly on your chart so you can focus on execution rather than analysis.
Fair Value Gaps on TradingView: Setup Guide
TradingView is the most popular platform for FVG trading because of its charting flexibility and the availability of community-built indicators. Here is how to get set up.
-
Open any chartand switch to a candlestick view. FVGs require candle data—they do not work on line or area charts. Open any chartand switch to a candlestick view. FVGs require candle data—they do not work on line or area charts.
-
Set your timeframe.Start with the 15M for day trading or the 4H for swing trading.
-
Manually scan for three-candle patternswhere the wicks of candles 1 and 3 do not overlap. Draw a rectangle covering the gap between those wicks.
-
Mark the 50% level of each FVG with a horizontal line if your entry rule uses the midpoint.
-
Set price alertsat the 50% level so you do not have to watch the chart constantly.
For automated detection, TradingView’s indicator library includes several FVG tools. Look for indicators that mark both standard and inverse FVGs and that allow you to filter by minimum gap size to avoid micro-FVGs that are too small to trade.
Frequently Asked Questions About Fair Value Gaps
How do you identify a fair value gap on a chart?
Look for a three-candle sequence where the middle candle is large. If the high of the first candle is lower than the low of the third candle (for a bullish FVG) or the low of the first candle is higher than the high of the third candle (for a bearish FVG), the gap between the non-overlapping wicks is your fair value gap.
What is the difference between an imbalance and a fair value gap?
An imbalance is any one-sided price delivery zone on the chart. A fair value gap is a specific type of imbalance defined by the three-candle pattern with non-overlapping wicks. FVGs are more precise because they have exact boundaries, while imbalances are broader zones. All FVGs are imbalances, but not all imbalances are FVGs.
Is a fair value gap bullish or bearish?
It depends on the direction of the move that created it. A bullish FVG forms during an upward displacement and acts as potential support. A bearish FVG forms during a downward displacement and acts as potential resistance. The displacement candle (the large middle candle) determines the direction.
What is an inverse fair value gap (IFVG)?
An inverse FVG occurs when price trades completely through a fair value gap, closing beyond it. The FVG’s role flips—a formerly bullish FVG becomes bearish resistance, and a formerly bearish FVG becomes bullish support. This is useful for re-entering after a setup fails.
What is OB and FVG in trading?
OB stands for Order Block and FVG stands for Fair Value Gap. Both terms are used in Smart Money Concepts. An order block is a selected candle or range before a move; an FVG is a three-candle wick pattern. Some traders use them together, but the markings do not identify institutions or make a setup high probability.
How do you trade fair value gaps profitably?
There is no universally profitable FVG rule established here. A trader could define a trend filter, entry, stop, and target in advance, then test that exact rule set with costs included; a 2:1 reward-to-risk ratio alone does not establish positive expectancy.
Putting It All Together
Fair value gaps are one of the most practical concepts in the Smart Money toolkit because they give you something most price action methods lack: a specific, bounded zone with clear entry, stop-loss, and invalidation levels. Unlike vague “support and resistance areas,” an FVG tells you exactly where the inefficiency starts and ends.
An FVG is one chart condition, not a standalone result. If you combine it with other rules, define them in advance and account for the possibility that price crosses the zone.
If you evaluate an FVG rule, record the market, timeframe, entries, exits, and costs across a defined sample. A small sample does not establish that future trades will have the same result.
- Smart Money Concepts
- Fair Value Gap
- FVG
- ICT
- Order Blocks
- Price Action
Do this automatically
ILPAC marks order blocks, FVGs, liquidity sweeps and BOS/CHoCH on your TradingView chart automatically.