TradingView IndicatorFree to Use
Reversal Probability Profile
Free TradingView Indicator by AlgoAlpha — Reversal & Patterns
Reversal Probability Profile maps where confirmed price reversals have historically concentrated. Instead of treating every support or resistance level equally, it builds a price-based profile from confirmed pivot highs and lows and shows which areas have produced the greatest concentration of reversals.
34.2kviews
3.1kboosts
2026-09-04published
Best for
Trend followingReversal setupsBuy/sell signalsSupport/resistance
Works on
CryptoForexStocksIndices
What is Reversal Probability Profile?
Reversal Probability Profile [AlgoAlpha] maps where confirmed price reversals have historically concentrated. Instead of treating every support or resistance level equally, it builds a price-based profile from confirmed pivot highs and lows and shows which areas have produced the greatest concentration of reversals.
The profile combines pivot-based support and resistance, reversal density, price clustering, and a maximum reversal zone. This gives traders a structured view of where price has repeatedly changed direction and how the density at one level compares with the strongest reversal area in the current calculation range.
Active support and resistance levels also display a normalized Reversal Probability. This value represents the reversal density at that level relative to the highest-density profile bin. It is a relative density measure, not a statistical forecast of the probability that price will reverse.
Reversal Probability Profile Features
Reversal Probability Profile
Displays historical reversal density across the visible calculation range, with wider bins representing greater density relative to the maximum reversal zone.

TradingView Snapshot
Probability-Labeled Support and Resistance
Displays active pivot levels together with their price and normalized Reversal Probability, while broken levels can remain as faint historical references.
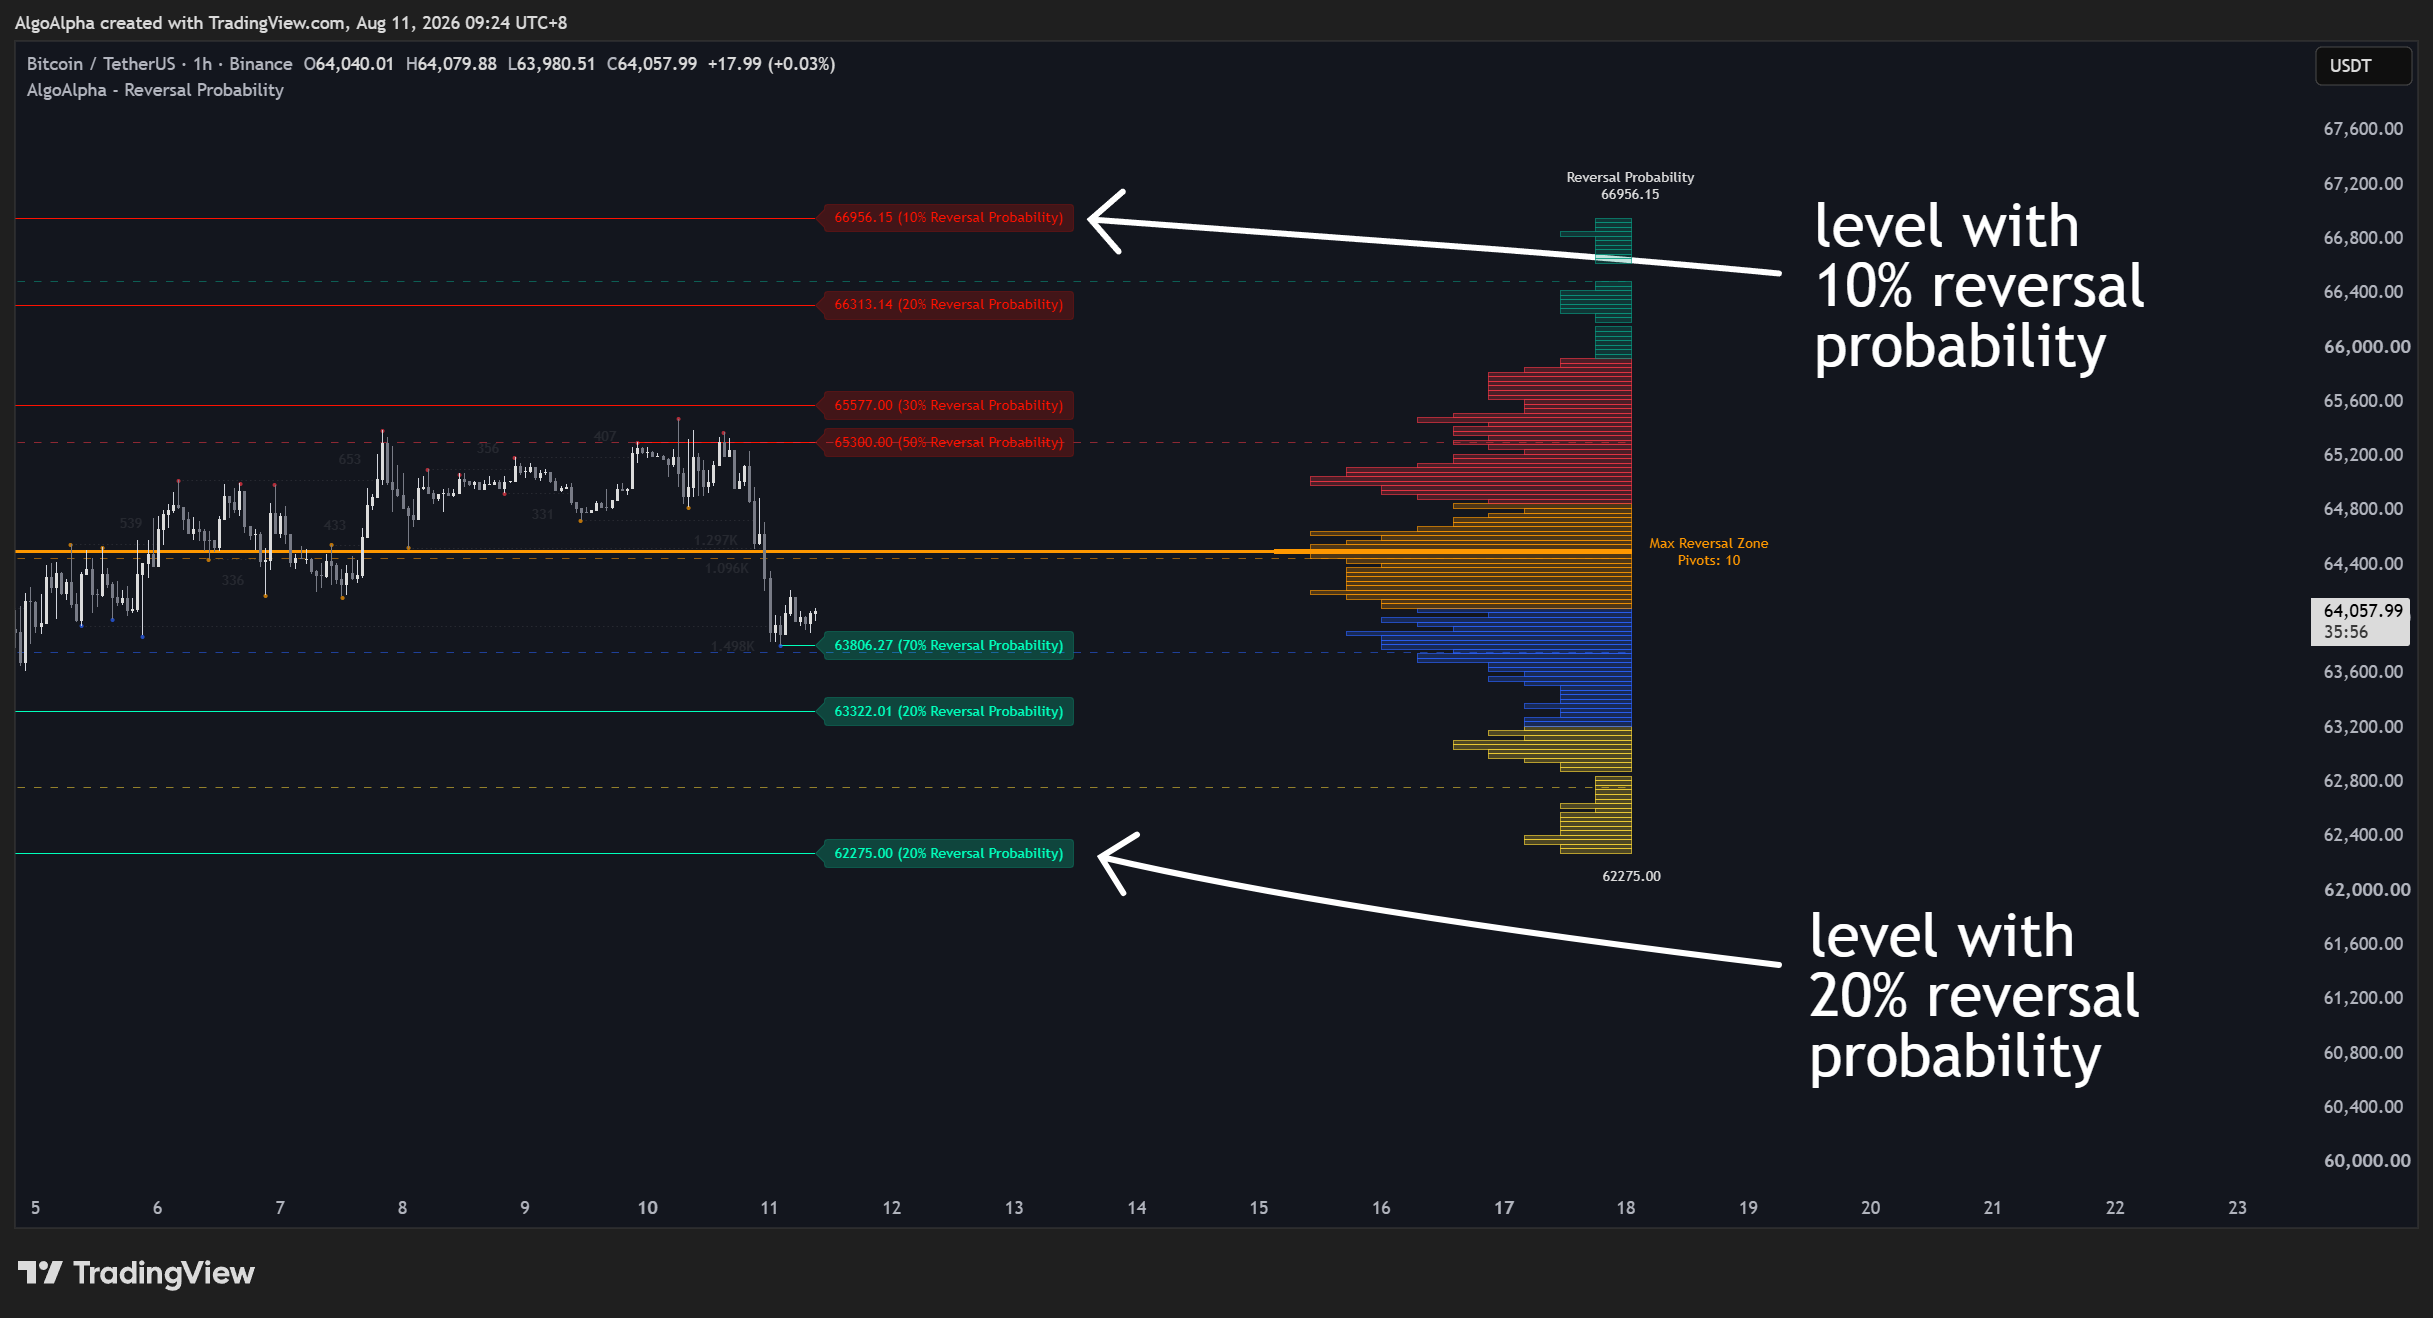
TradingView Snapshot
Max Reversal Zone
Highlights the profile bin with the greatest concentration of confirmed reversals and marks its corresponding price level.

TradingView Snapshot
Cluster Visualization
Color-codes pivot regions and can display cluster levels and historical pivot markers to show where reversal prices have grouped.

TradingView Snapshot
Reversal Alerts
Provides alerts for new support and resistance pivots, level breaks, maximum or high-density zone touches, and bullish or bearish reversal-zone touches.
How Reversal Probability Profile Works
• Pivot High — A confirmed local high where price is higher than the surrounding bars defined by the Pivot Left Bars and Pivot Right Bars settings. These pivots represent historical bearish reversal points.
• Pivot Low — A confirmed local low using the same left and right confirmation structure. These pivots represent historical bullish reversal points.
• Reversal Probability Profile — A price profile built from confirmed pivot highs and lows. Each pivot contributes to its corresponding price bin and nearby bins according to the Bin Smoothing Radius.
• Reversal Probability — The density of a price bin divided by the density of the tallest profile bin. The tallest bin is therefore 100%, while other levels are expressed relative to it. This measures relative historical reversal density rather than a statistical probability of a future reversal.
• Max Reversal Zone — The price bin containing the highest smoothed pivot count. It forms the profile's point of maximum reversal density.
• Pivot Clusters — Groups of historical pivot prices with similar price locations. The script groups these prices into clusters and uses separate colors to make recurring reversal regions easier to distinguish.
• Support and Resistance Levels — Horizontal levels created from confirmed pivot lows and highs. Nearby levels can be filtered using an ATR-based overlap distance so that similar pivots do not produce excessive duplicate levels.
How to Use Reversal Probability Profile
• Start with the profile — Look for the widest sections. These show price regions where confirmed reversals have concentrated more heavily than surrounding areas.
• Use the Max Reversal Zone as a reference — It represents the strongest reversal-density bin in the current calculation window and provides the 100% reference used by the other probability values.
• Compare active levels by Reversal Probability — A level closer to 100% sits in a region with reversal density closer to the profile maximum. Treat this as relative historical density rather than a forecast of future reversal odds.
• Distinguish support from resistance — Green support levels originate from pivot lows, while red resistance levels originate from pivot highs. Watch how price behaves when it returns to these areas.
• Read clusters as broader areas of interest — Repeated pivots near similar prices form clusters. These can help identify reversal regions that are supported by several historical turning points instead of one isolated pivot.
• Use broken levels for context — When enabled, previously broken support and resistance remain visible as faint dotted references. This helps separate active levels from historical structure.
• Adjust Pivot Left Bars and Pivot Right Bars to control sensitivity — Lower values identify smaller local turns. Higher values require broader price structure before a pivot is confirmed.
• Adjust the Calculation Lookback and Pivot Memory to control how much historical reversal structure contributes to the current profile.
• Use the profile together with current price action — A high-density zone identifies where reversals occurred historically. It does not by itself confirm that price will reverse on the next test.
Add this indicator to your chart.
Reversal Probability Profile is free to use on TradingView. Add it to any chart in seconds.