TradingView IndicatorFree to Use
Fibonacci Trend Continuation Signals
Free TradingView Indicator by AlgoAlpha — Trend Following
Fibonacci Trend Continuation Signals maps Fibonacci retracement levels inside an adaptive trend structure. It combines a smoothed price midline, volatility-based outer bands, and Fibonacci ratios to show where price is trading within the current bullish or bearish trend range.
33.3kviews
2.5kboosts
2026-08-18published
Best for
Trend followingReversal setupsBuy/sell signalsSupport/resistance
Works on
CryptoForexStocksIndices
What is Fibonacci Trend Continuation Signals?
Fibonacci Trend Continuation Signals [AlgoAlpha] maps Fibonacci retracement levels inside an adaptive trend structure. It combines a smoothed price midline, volatility-based outer bands, and Fibonacci ratios to show where price is trading within the current bullish or bearish trend range.
The trend changes only when price moves beyond a volatility-adjusted outer band. Once a direction is active, the script projects 0.236, 0.382, 0.500, 0.618, and 0.786 levels between the active outer band and the midline. This creates a moving Fibonacci framework that adjusts as price and volatility change.
Continuation signals appear when price closes back through an enabled Fibonacci level in the direction of the active trend. This lets traders use retracements within an established trend instead of treating each Fibonacci level as a fixed reversal point.
Fibonacci Trend Continuation Signals Features
Adaptive Fibonacci Profile
Displays five configurable Fibonacci levels between the active volatility band and trend midline.

TradingView Snapshot
Trend Continuation Signals
Shows bullish and bearish markers when price closes through an enabled Fibonacci level in the direction of the active trend.

TradingView Snapshot
Current Level Labels
Shows the current price value of each enabled Fibonacci level at the latest bar.

TradingView Snapshot
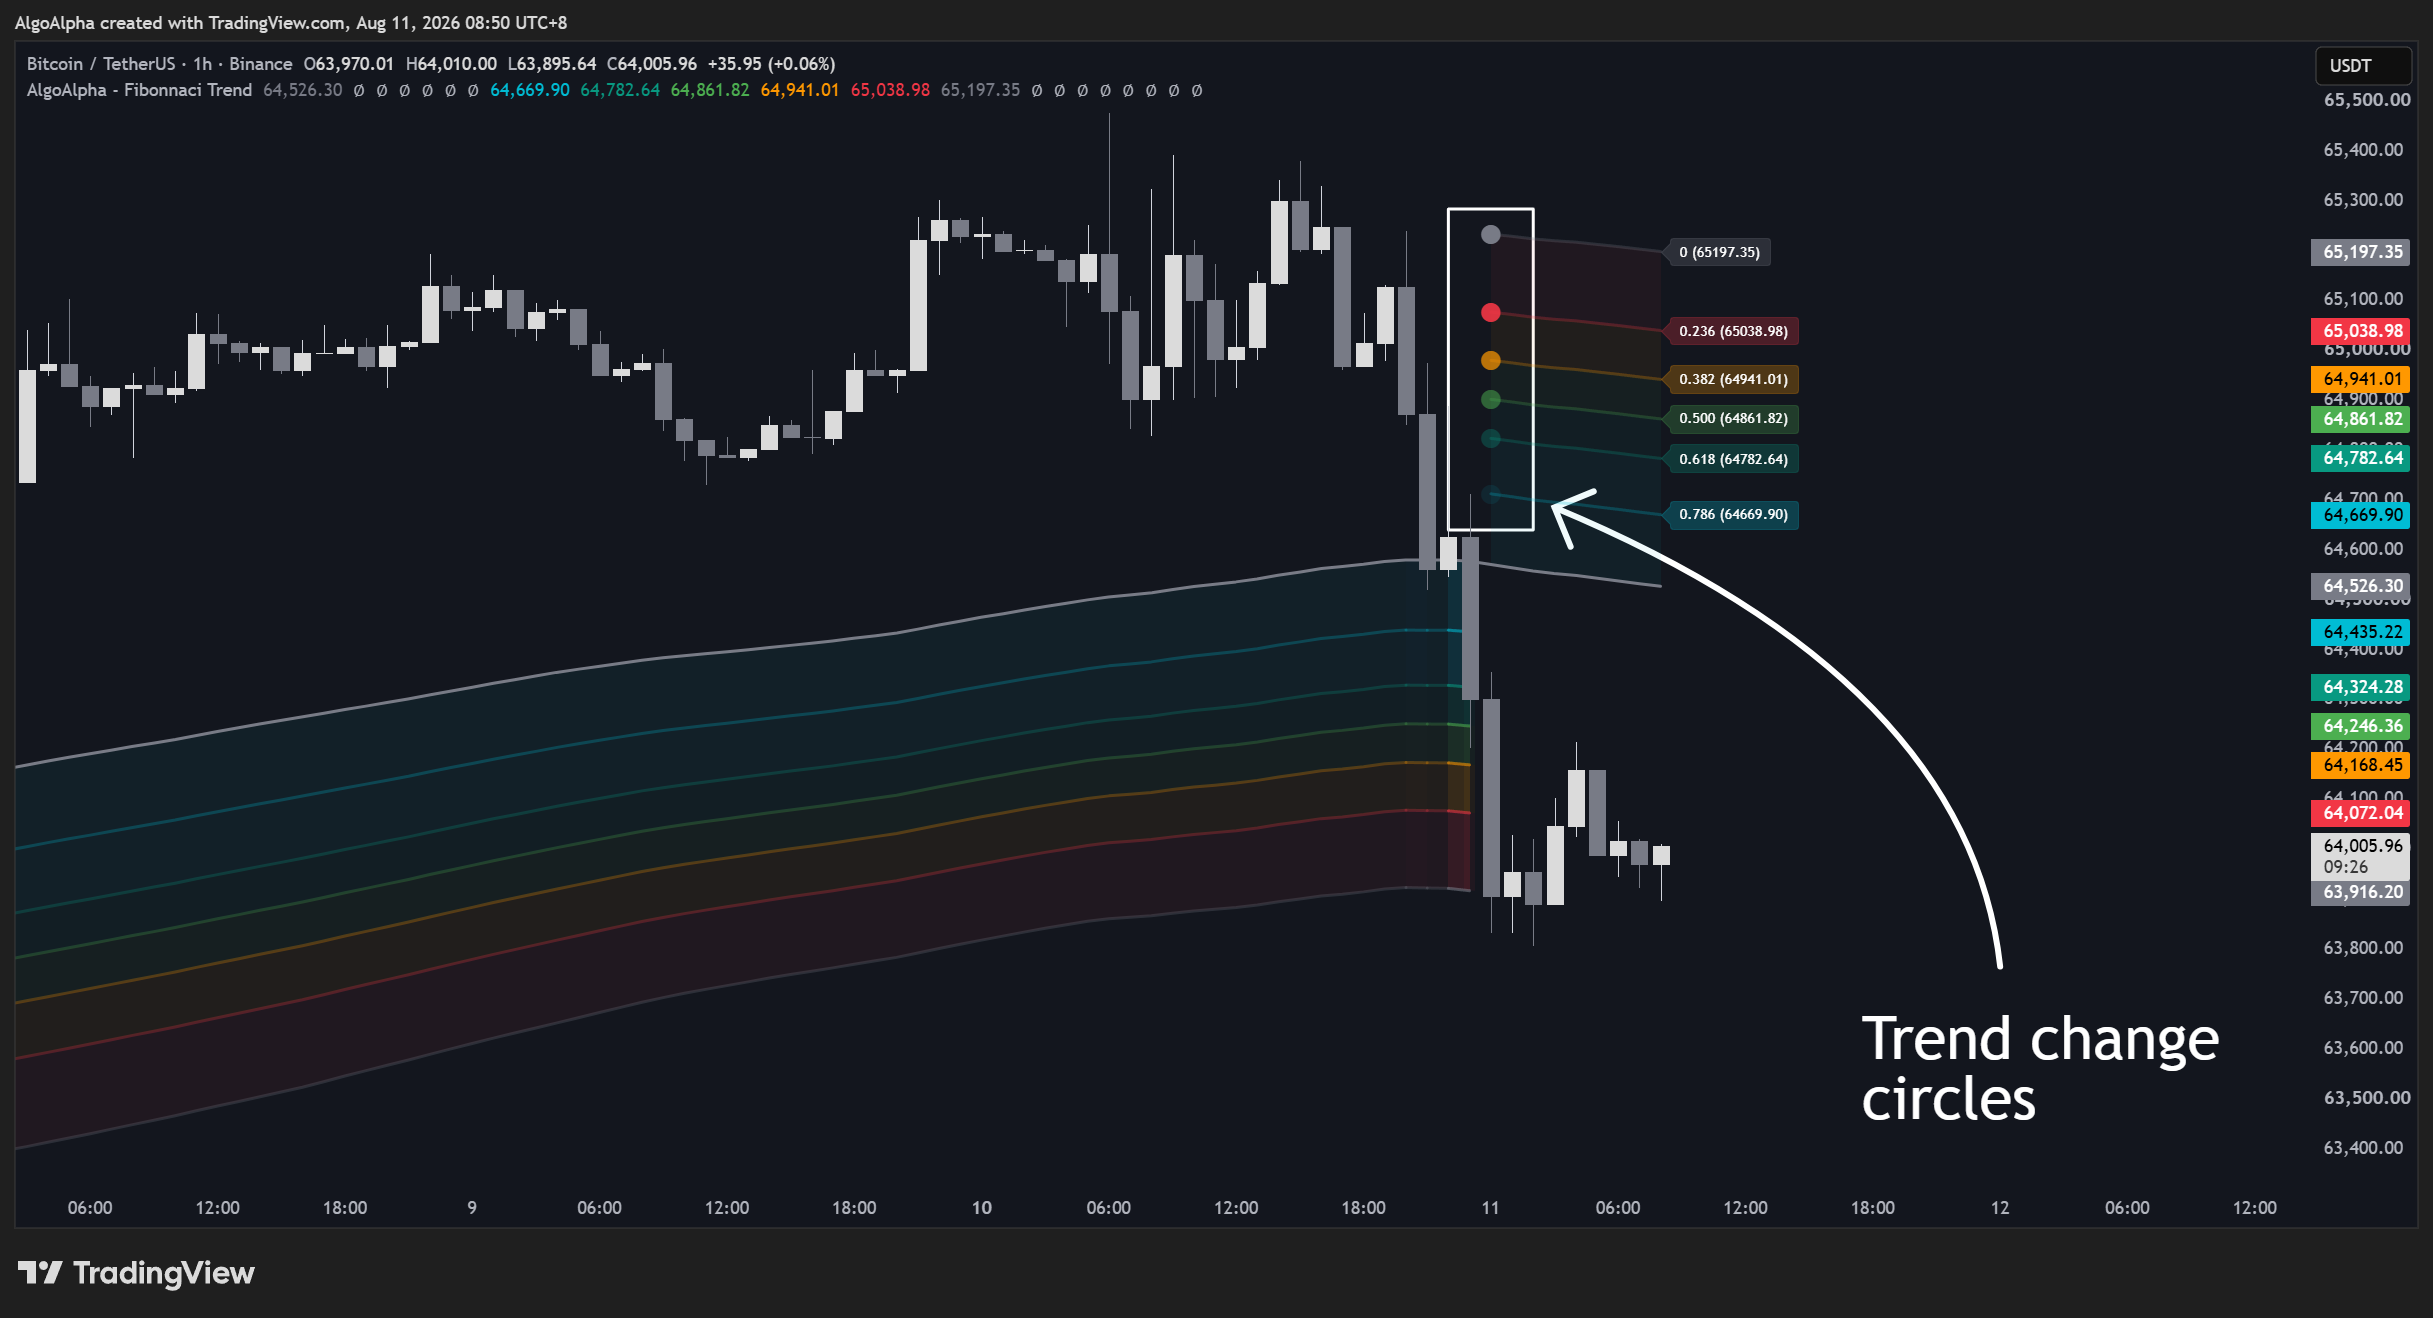
Trend Change Markers
Marks the Fibonacci structure when a new bullish or bearish trend begins.
TradingView Snapshot
How Fibonacci Trend Continuation Signals Works
• Trend Midline — An exponential moving average of closing price. It forms the central reference for the trend structure and the endpoint of the Fibonacci range.
• Volatility Bands — Outer boundaries placed above and below the midline using a smoothed measure of the high-to-low price range. Price crossing an outer band changes the active trend direction.
• Fibonacci Trend Range — The distance between the active outer band and the midline. In bullish trends, levels are measured upward from the lower band. In bearish trends, they are measured downward from the upper band.
• Fibonacci Levels — The 0.236, 0.382, 0.500, 0.618, and 0.786 ratios divide the active trend range into retracement zones that move with the underlying trend structure.
• Continuation Signal — A bullish signal occurs when price closes upward through an enabled Fibonacci level during a bullish trend. A bearish signal occurs when price closes downward through an enabled Fibonacci level during a bearish trend.
How to Use Fibonacci Trend Continuation Signals
• Identify the active trend structure — A bullish structure projects Fibonacci levels from the lower band toward the midline, while a bearish structure projects them from the upper band toward the midline.
• Watch price during a retracement — Use the displayed Fibonacci zones to see how far price has moved through the active trend range.
• Look for continuation signals — An upward triangle shows that price crossed above an enabled Fibonacci level during a bullish trend. A downward triangle shows the equivalent bearish close below a level.
• Compare signals with price structure — Use nearby swing points, support, resistance, or your existing confirmation method before acting on a continuation signal.
• Adjust Midline Length, Pivot Length, and Band Width to control how quickly the trend framework responds to price and how wide its outer boundaries are.
• Enable or disable individual Fibonacci levels to keep only the retracement levels relevant to your method.
More Trend Following Indicators
Explore other trend following TradingView indicators by AlgoAlpha.
Add this indicator to your chart.
Fibonacci Trend Continuation Signals is free to use on TradingView. Add it to any chart in seconds.