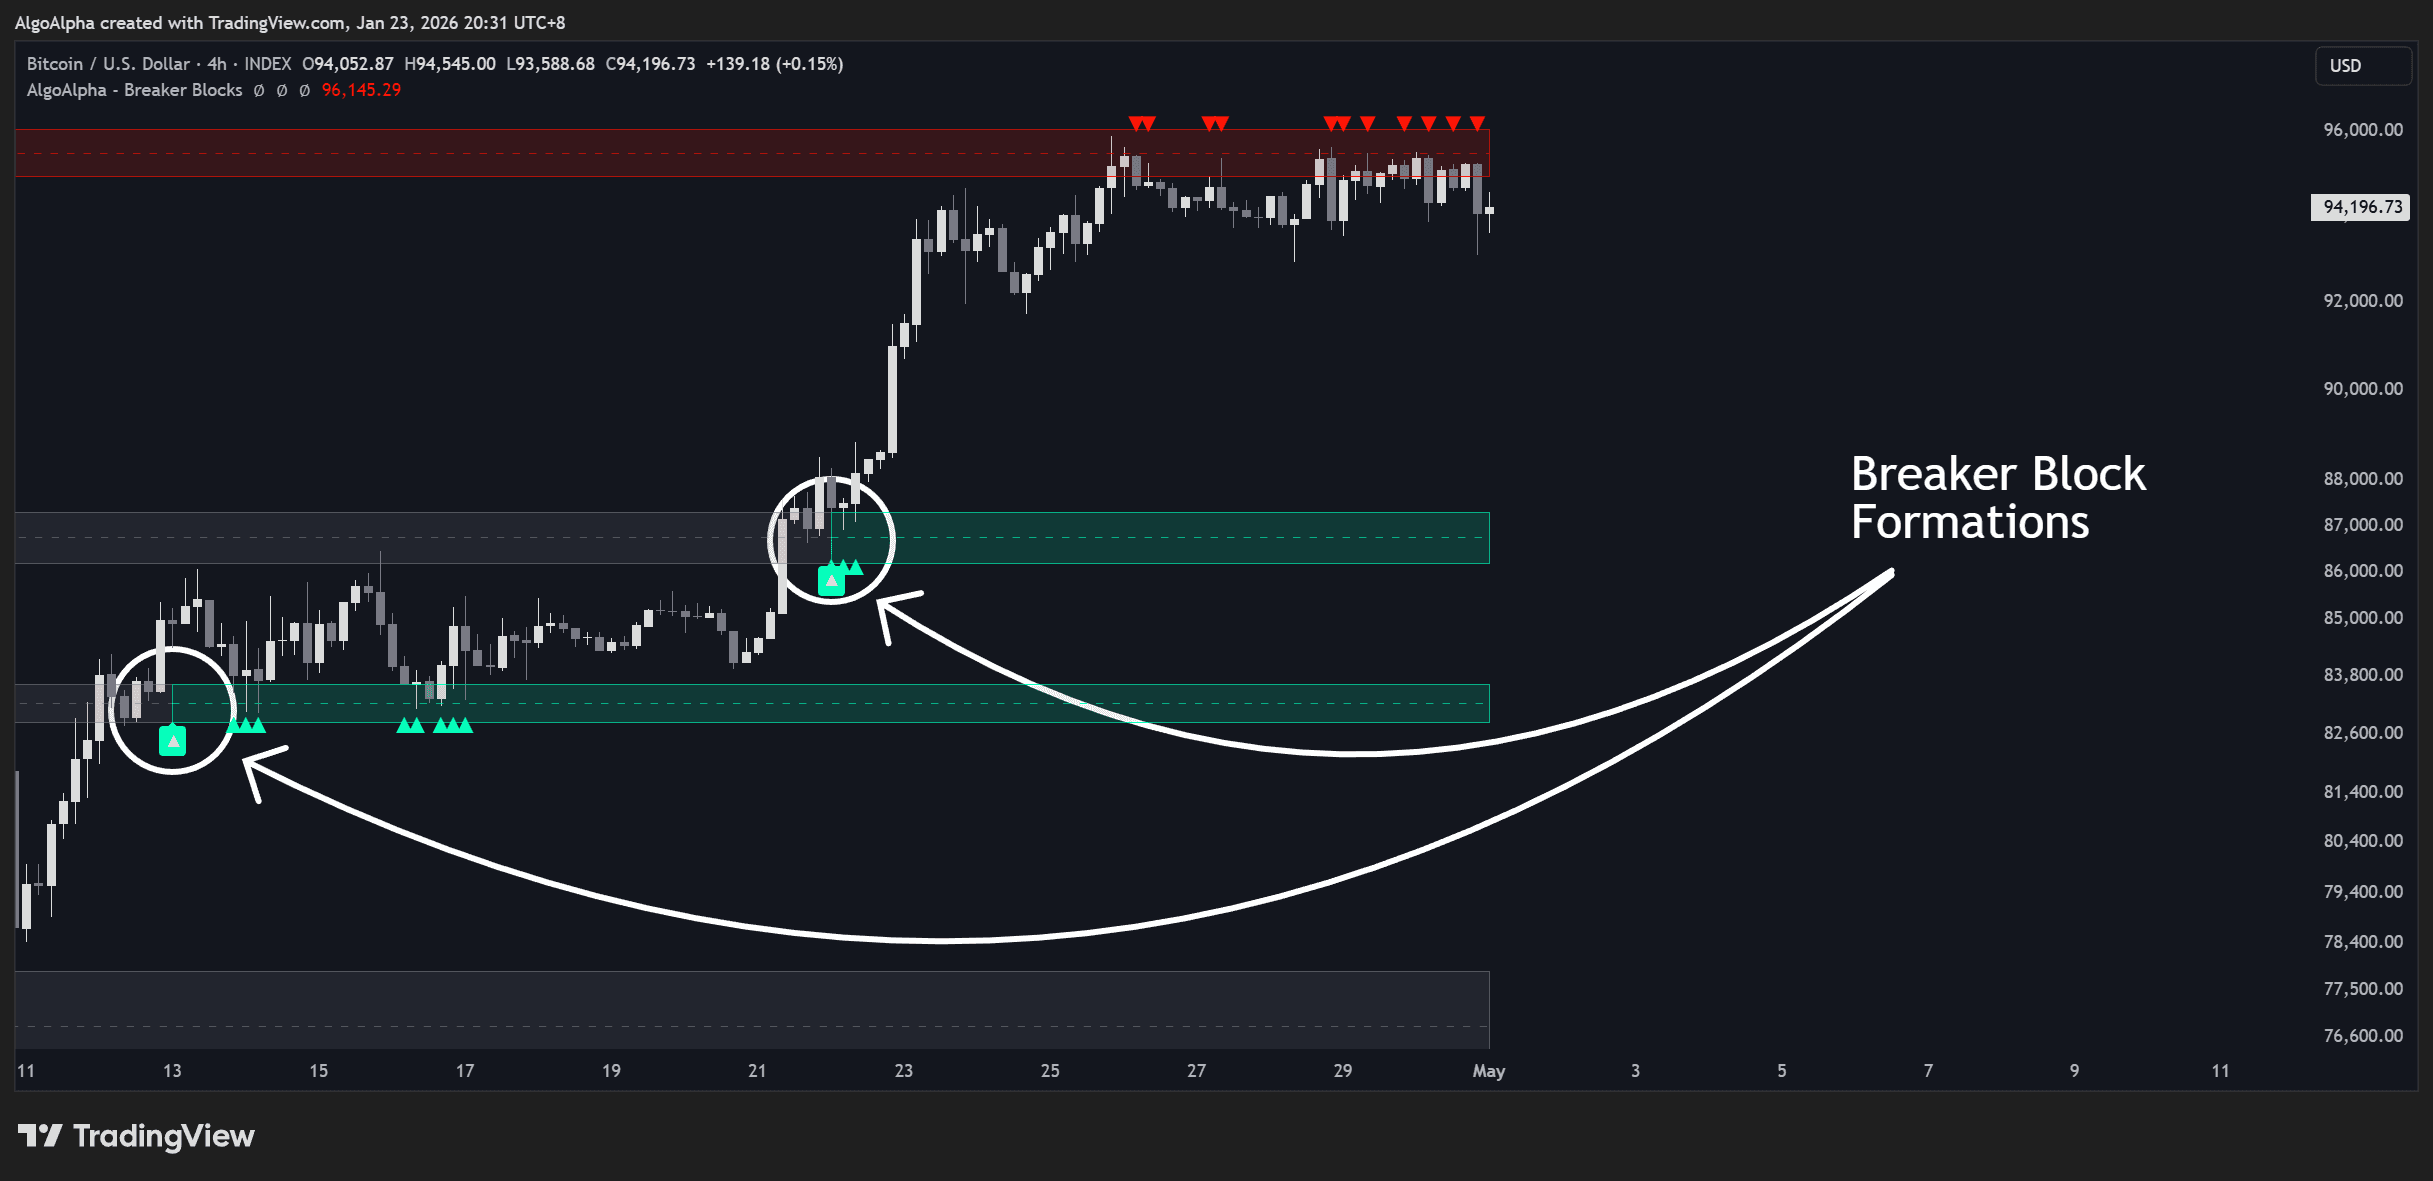
If you’ve been reading about Order Blocks, Liquidity Grabs, orMarket Structure Shifts (MSS) from other providers, you likely understand the theory. But theory often fails in practice because of one fatal flaw:Human Subjectivity. This guide will teach you exactly how to trade Breaker Blocks—the most powerful reversal pattern in modern trading—and how to use a new, Z-Score-based algorithmic approach to identify them with mathematical precision.
What is a Breaker Block?
ABreaker Blockis essentially a failed Order Block. It represents a significant shift in market sentiment where "trapped" traders are forced to exit their positions, fueling a sharp reversal.
Here is the psychology behind the pattern:
-
The Trap (Order Block):Big institutions place orders, causing a price consolidation. Retail traders see this and enter positions, placing their stop losses just beyond the range. The Trap (Order Block):Big institutions place orders, causing a price consolidation. Retail traders see this and enter positions, placing their stop losses just beyond the range.
-
The Liquidity Grab:Price aggressively movesagainstthe trend to trigger those stop losses (the "Stop Hunt"), creating a new high or low. The Liquidity Grab:Price aggressively movesagainstthe trend to trigger those stop losses (the "Stop Hunt"), creating a new high or low.
-
The Break:Suddenly, price reverses with high momentum, slicing right through the original Order Block. The zone that was supposed to hold as support has now beenmitigatedand "broken." The Break:Suddenly, price reverses with high momentum, slicing right through the original Order Block. The zone that was supposed to hold as support has now beenmitigatedand "broken."
-
The Breaker:When price returns to this broken zone, the trapped traders who are underwater frantically close their positions at breakeven. This flood of orders turns the old support into new resistance (or vice versa). The Breaker:When price returns to this broken zone, the trapped traders who are underwater frantically close their positions at breakeven. This flood of orders turns the old support into new resistance (or vice versa).
In simple terms:A Bullish Order Block that fails becomes a Bearish Breaker Block.
The Problem with Traditional Indicators
Most "SMC" indicators on the market (like those from LuxAlgo or Fluxcharts) rely on standard candle definitions to find these blocks. They look for "the last up candle before the down move."
The problem?Volatility.In 2026, markets are noisier. A standard indicator might flag 50 "Order Blocks" a day, most of which are fakeouts. They lack a filter forintensity.
The 2026 Solution: Quantifying the "Impulse"
To trade Breaker Blocks successfully today, we need to ignore standard price action and focus onStatistical Anomalies.
We have developed the Breaker Blocks Signals AlgoAlphaindicator to solve this. Instead of just looking at candle color, it calculates anormalized Z-Scoreof price momentum.
-
The Math:It measures the "distance covered" over a specific window. The Math:It measures the "distance covered" over a specific window.
-
The Signal:Only moves with aZ-Score above 4are marked as "Algorithmically Significant." The Signal:Only moves with aZ-Score above 4are marked as "Algorithmically Significant."
This effectively filters out the noise. We aren't just looking for a "move"; we are looking for a violent, institutional impulse that changes the market regime.
Strategy: How to Trade Breaker Blocks Step-by-Step
Here is your checklist for trading this setup using the AlgoAlpha indicator:
Step 1: Identify the "Pending" Block (Gray Zone)
Install the Breaker Blocks Signalsscript. Watch for Gray Zones. These appear when the algorithm detects a Z-Score impulse (>4).
- What it means:Smart money has entered the building. A massive move has occurred, leaving an Order Block behind. What it means:Smart money has entered the building. A massive move has occurred, leaving an Order Block behind.
Step 2: The Invalidation (The Break)
Wait for price to closecompletely throughthe Gray Zone.
-
The Transformation:The script will automatically flip the color of the zone.If price smashesdownthrough a bullish block, it turnsRED (Bearish Breaker).If price smashesupthrough a bearish block, it turnsGREEN (Bullish Breaker). The Transformation:The script will automatically flip the color of the zone.
-
If price smashesdownthrough a bullish block, it turnsRED (Bearish Breaker). If price smashesdownthrough a bullish block, it turnsRED (Bearish Breaker).
-
If price smashesupthrough a bearish block, it turnsGREEN (Bullish Breaker). If price smashesupthrough a bearish block, it turnsGREEN (Bullish Breaker).
Step 3: The Retest & Entry (Sniper Mode)
This is where patience pays off. Do not chase the breakout. Wait for price to return to the colored Breaker Block.
-
The Confluence:Look for the indicator’sRejection Markers(small triangles ▲/▼). These appear when price enters the zone and shows signs of rejection. The Confluence:Look for the indicator’sRejection Markers(small triangles ▲/▼). These appear when price enters the zone and shows signs of rejection.
-
Your Entry:Enter when you see the rejection marker inside the colored zone. Your Entry:Enter when you see the rejection marker inside the colored zone.
Step 4: Risk Management
-
Stop Loss:Place your stop just outside the Breaker Block zone. If price reclaims this level, the setup is invalid. Stop Loss:Place your stop just outside the Breaker Block zone. If price reclaims this level, the setup is invalid.
-
Take Profit:Target the next Liquidity Pool(recent swing high/low) or the next opposing Order Block. Take Profit:Target the next Liquidity Pool(recent swing high/low) or the next opposing Order Block.
Why This Indicator Wins
Unlike competitors who flood your chart with every minor pivot, the AlgoAlpha Breaker Blocks Signalsuses:
-
Z-Score Filtering:Only statistically significant moves create zones. Z-Score Filtering:Only statistically significant moves create zones.
-
Auto-Mitigation:Zones vanish or flip automatically when price invalidates them, keeping your chart clean. Auto-Mitigation:Zones vanish or flip automatically when price invalidates them, keeping your chart clean.
-
Max Box Age:Old, stale zones are removed to keep you focused oncurrentprice action. Max Box Age:Old, stale zones are removed to keep you focused oncurrentprice action.
Conclusion
Trading is about identifying where the pain points are. Breaker Blocks are the visual representation of institutional "pain" turning into profit. By combining the theory ofSmart Money Conceptswith the statistical power ofZ-Score analysis, you can stop guessing and start trading with the algorithm.
Add the "Breaker Blocks Signals" Indicator to Your TradingView Chart Here
- Algorithmic Trading
- TradingView
- Smart Money Concepts
- Z-Score Trading
- Breaker Blocks
- Free Indicator
- ICT Concepts